Weight-Loss Plateau or Metabolic Adaptation?

Sean Selters • July 30, 2026

What an RMR Test Can, and Cannot, Tell You
Weight-Loss Plateau or Metabolic Adaptation? What an RMR Test Can and Cannot Tell You

You have been following the same calorie target, maintaining your workouts, and trying to remain consistent.


At first, your weight decreased. Now the scale has stopped moving.


Does that mean your metabolism has slowed? Are you no longer in a calorie deficit? Has your body entered “starvation mode”?


Not necessarily.


A weight-loss plateau can have several possible explanations. Your energy requirements may have changed as you lost weight. Your daily activity may be different. Food intake may be harder to estimate than expected. Water retention may temporarily hide fat loss. In some cases, metabolic adaptation may also contribute.


An RMR test for weight loss can help by measuring how many calories your body currently uses at rest. It replaces one piece of the calorie equation with a measured value instead of relying entirely on a generalized calculator.


However, an RMR test does not measure everything you burn in a day, prove that you are in a calorie deficit, or diagnose why your progress has slowed.


Understanding that distinction is essential before using the result to evaluate a weight-loss plateau.


What Is a Weight-Loss Plateau?

A weight-loss plateau is a period during which your average body weight stops decreasing despite continued efforts to lose weight.


A few days without movement on the scale does not necessarily represent a true plateau. Body weight can fluctuate because of:

  • Water retention
  • Sodium and carbohydrate intake
  • Glycogen storage
  • Recent exercise
  • Menstrual-cycle-related changes
  • Food and fluid still in the digestive system
  • Bowel movements
  • Inflammation
  • Differences in weigh-in timing


These factors can temporarily hide changes in body fat.


Before concluding that progress has stopped, look at the broader trend. Compare weight averages across several weeks rather than reacting to one weigh-in or a few days of stable weight.


If the longer-term trend is genuinely flat, the next question is not simply, “Is my metabolism broken?”


The better question is, “Has something changed in my total energy balance?”


Common Reasons Weight Loss Slows

Weight loss is rarely linear. Several changes can gradually narrow or eliminate the calorie deficit that existed at the beginning of a program.


Your body now requires less energy

A smaller body generally requires fewer calories to maintain than a larger body.


After losing weight, your body has less total tissue to support and less mass to move during daily activities. The calorie intake that created a meaningful deficit at your starting weight may create a smaller deficit at your current weight.


Research on human weight change shows that energy requirements adjust dynamically as body weight changes. This is why the traditional idea that every fixed calorie deficit produces the same predictable rate of weight loss indefinitely does not accurately represent human physiology. (PubMed)


Your resting metabolic rate may have decreased

Resting metabolic rate, or RMR, is the energy your body uses at rest to support basic functions such as breathing, circulation, temperature regulation, brain activity, and organ function.


As body weight and body composition change, RMR will commonly change as well.


A decrease in RMR after weight loss is not automatically abnormal. Some reduction is expected because there is less body tissue requiring energy.


The important question is whether the decrease is reasonably explained by the change in body size and composition, or whether energy expenditure has fallen more than expected.


Your daily movement may have changed

Total daily energy expenditure includes more than formal exercise.


It also includes walking, standing, household activity, occupational movement, posture, fidgeting, and other forms of spontaneous movement. These activities can change without being obvious.


Someone may continue completing the same scheduled workouts while taking fewer steps, sitting more during the day, or moving less vigorously outside the gym.


An RMR test does not measure these changes.


Food intake may be different from the recorded estimate

Food intake is difficult to measure precisely, even for someone making a careful and honest effort.


Serving sizes, cooking oils, beverages, restaurant meals, condiments, snacks, and weekend routines can create differences between recorded and consumed calories.


This is not necessarily a question of willpower or dishonesty. Calorie labels and portion estimates are imperfect, and small differences can accumulate.


Research modeling weight-loss plateaus has found that intermittent differences between prescribed and actual intake can substantially affect when a plateau occurs. That does not mean metabolic adaptation is irrelevant, but it does mean that adaptation should not automatically be treated as the only explanation. (American Journal of Clinical Nutrition)


Water changes may be hiding continued fat loss

Fat mass and scale weight are not identical measurements.


A person could lose some fat while temporarily retaining enough water to keep total scale weight unchanged. Hard training, higher sodium intake, additional carbohydrates, stress, poor sleep, travel, and menstrual-cycle changes can all influence short-term scale weight.


A stable scale over a brief period therefore does not prove that fat loss has stopped.


Medications, sleep, health conditions, and other factors may matter

Body weight can be affected by sleep, medications, health conditions, genetics, environment, food access, and numerous behavioral factors. A plateau should not automatically be reduced to one explanation. (NIDDK)


This is one reason Body Fat USA treats RMR as a measurement, not a diagnosis.


What Does Metabolic Adaptation Mean?

Metabolic adaptation, sometimes called adaptive thermogenesis, refers to a reduction in energy expenditure that is greater than would be predicted from changes in body weight and body composition alone.


Consider two different reasons RMR may decline after weight loss:

  1. You now have less body tissue requiring energy.
  2. The remaining tissues may also be using somewhat less energy than predicted.


The first change is an expected result of becoming smaller. The second is what researchers generally mean when discussing metabolic adaptation.


Metabolic adaptation is not the same as a permanently “damaged” metabolism. It is also not an on-or-off condition in which the body suddenly stops allowing weight loss.


The amount of adaptation varies substantially among individuals, and its long-term significance remains an active research question.

In one analysis of 109 participants undergoing calorie restriction, average RMR decreased by approximately 101 calories per day after an average weight loss of 7.3 kilograms. Researchers estimated that about 60% of that decrease was explained by the loss of energy-expending tissue, while the remaining 40% was attributed to metabolic adaptation. Individual responses varied considerably. (Nature)


Other research has found that metabolic adaptation may slow the rate of weight loss or increase the time required to reach a goal. However, it has not consistently been shown to be a major independent cause of long-term weight regain. (PubMed Central (PMC))


The practical conclusion is important:

Metabolic adaptation is real, but it should not be assumed to explain every plateau.


Measured RMR Versus a Calculator Estimate

Online calorie calculators generally estimate resting metabolic rate using some combination of:

  • Age
  • Sex
  • Height
  • Weight
  • Sometimes body composition


These formulas are developed from averages across groups of people. They may provide a reasonable starting point, but they do not measure the individual sitting in front of the computer.


Two people with similar height, weight, age, and sex can have different resting energy expenditures.


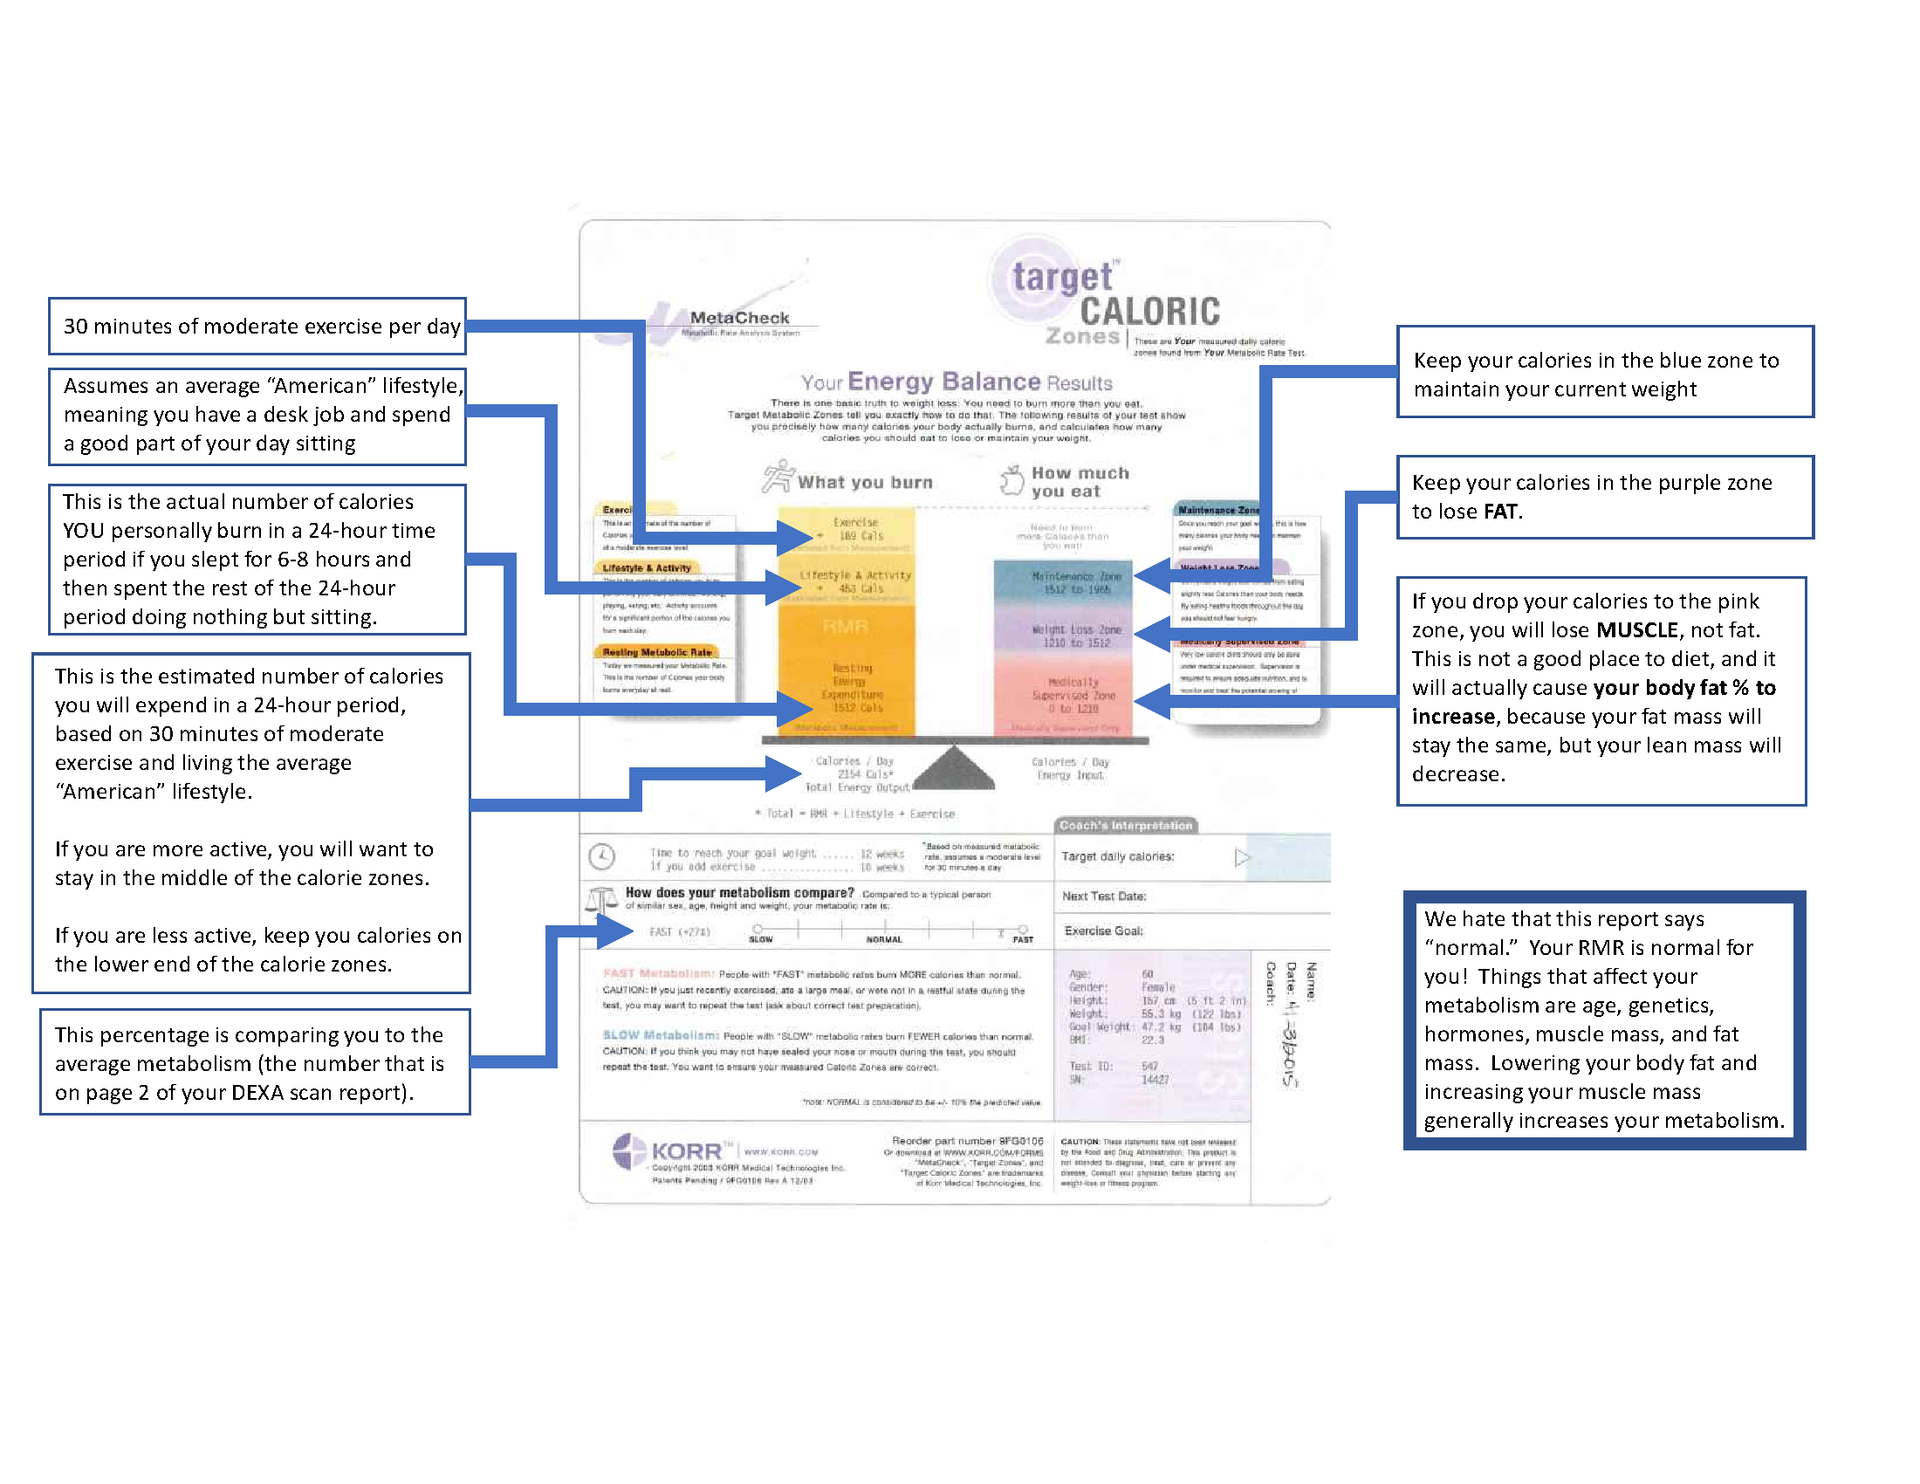
A measured RMR test uses indirect calorimetry. At Body Fat USA, the KORR MetaCheck measures oxygen uptake while the client rests and breathes through the testing equipment. The system then calculates an estimated 24-hour resting energy expenditure.


This gives you an individualized measurement under the conditions present during the test.


However, “measured” should not be interpreted as “perfect” or “permanent.”


RMR results can be influenced by:

  • Recent food intake
  • Caffeine and other stimulants
  • Exercise
  • Stress or anxiety
  • Illness
  • Sleep
  • Current energy restriction
  • Testing position
  • Environmental conditions
  • Whether the client reached a stable resting state


Indirect calorimetry devices also differ in their methods, validation, and reliability. A 2025 review found that the performance of indirect calorimetry devices varied by device type and model, reinforcing the importance of standardized preparation and cautious interpretation. (Springer)


An RMR test is more personalized than an equation, but it is still a physiological measurement with normal technical and biological variability.


Why Body Weight and Lean Mass Affect Energy Requirements

Body composition helps provide context for changes in RMR.


Fat-free mass is strongly associated with resting energy expenditure, but fat-free mass is not a single uniform tissue. It includes:

  • Skeletal muscle
  • Organs
  • Body water
  • Connective tissue
  • Bone and other nonfat components


Different tissues use energy at very different rates.


Internal organs are highly metabolically active relative to their size. Resting skeletal muscle uses energy too, but not at the same rate per pound as the brain, liver, heart, or kidneys.


This means the common statement that “more muscle always produces a dramatically faster metabolism” is too simplistic.


Maintaining lean tissue during weight loss is valuable, but preserving skeletal muscle does not guarantee that RMR will remain unchanged. Weight loss can reduce RMR through changes in several tissues, reduced body mass, and possible metabolic adaptation. (Nature)


This is also why body weight alone cannot fully explain a change in resting energy expenditure.


What an RMR Test for Weight Loss Can Reveal

An RMR test can provide several useful pieces of information.


Your current resting calorie expenditure

The result estimates how many calories your body would use over 24 hours while at rest.


This represents the energy required for basic physiological functions. It is not the same as the number of calories you burn during a normal day.


Whether a calculator may be overestimating or underestimating your RMR

The test allows you to compare your measured result with a predictive equation.


For example, a calculator may estimate an RMR of 1,750 calories while the test measures 1,520 calories under standardized conditions.


That difference could be relevant when evaluating assumptions used in a weight-management plan.


It still would not reveal your total daily expenditure or automatically determine how many calories you should eat.


A baseline for future comparison

A baseline RMR test can be compared with a later test after meaningful weight loss, body-composition change, or an extended period of training.


A repeat test may show that resting expenditure:

  • Remained relatively stable
  • Decreased approximately as expected
  • Decreased more than anticipated
  • Increased after a change in body size or composition


The result should be interpreted in the context of test preparation, body composition, and normal measurement variability.


Better information to share with a qualified professional

A measured RMR gives a registered dietitian, physician, or qualified fitness professional more individualized information than a generic equation.


That professional can consider the RMR result alongside medical history, food intake, physical activity, goals, medications, and other relevant factors.


Body Fat USA provides the measurement. It does not prescribe a calorie target, diet, medication, or training program.


What an RMR Test Cannot Tell You

An RMR result is useful, but its limitations are just as important as the number printed on the report.


It cannot measure your total daily calorie expenditure

RMR measures resting expenditure.


Your total daily energy expenditure also includes:

  • Exercise
  • Walking and other daily movement
  • Occupational activity
  • Spontaneous movement
  • The energy used to digest and process food


Physical activity is generally the most variable part of total daily energy expenditure. (PubMed Central (PMC))


A measured RMR can be used as one input when estimating total expenditure, but it does not measure your entire day.


It cannot prove that you are in a calorie deficit

An RMR test does not measure how many calories you eat.


It also does not directly measure your exercise expenditure, step count, daily movement, or the thermic effect of your diet.


Therefore, it cannot confirm that your average calorie intake is below your average total expenditure.


This is the central limitation when someone asks, “Why am I not losing weight in a calorie deficit?”


A true, sustained energy deficit must eventually be supplied from stored body energy. However, calorie intake and total expenditure are usually estimated rather than continuously measured, and short-term scale changes may be obscured by water and other nonfat components. (PubMed)


An RMR test improves one estimate. It does not complete the entire energy-balance equation.


It cannot diagnose metabolic adaptation from one test

A single RMR result cannot show how much your metabolism has changed from an earlier point.


To evaluate a possible change, you would need:

  • A valid baseline measurement
  • A properly standardized repeat measurement
  • Body-composition information
  • A method for estimating how much of the change would be expected from tissue loss
  • Consideration of current energy balance and test conditions


Even in research, metabolic adaptation is typically estimated as the difference between measured RMR and a predicted RMR based on body composition. There is no simple clinical number on an RMR report that definitively diagnoses metabolic adaptation. (Nature)


It cannot diagnose a thyroid or hormonal condition

A low RMR result is not a thyroid test.


It cannot diagnose:

  • Hypothyroidism
  • Polycystic ovary syndrome
  • Insulin resistance
  • Cushing’s syndrome
  • Low testosterone
  • Menopause-related conditions
  • Another endocrine or metabolic disorder


These conditions require an appropriate medical evaluation, which may include symptoms, medical history, physical examination, and laboratory testing.


It cannot determine the best diet or exercise program

An RMR test does not tell you:

  • Which eating pattern is best for you
  • How much protein you personally need
  • Whether you should follow a low-carbohydrate or low-fat diet
  • Which workout program to use
  • Whether a medication should be started or changed
  • Whether your calorie target is medically appropriate
  • Whether your current approach is nutritionally adequate


Those decisions require broader assessment by an appropriately qualified professional.


It cannot prove that your metabolism is damaged

A result below a calculator estimate does not mean your metabolism is permanently broken.


Prediction equations have individual error, testing conditions affect results, and resting expenditure naturally differs among people.

The result is a measurement to interpret, not a verdict about your body.


When Combining RMR with DEXA Is Useful

RMR and DEXA answer different questions.


An RMR test estimates how much energy your body uses at rest.


A DEXA body composition scan measures and reports fat mass, lean tissue mass, bone mineral content, body-fat percentage, and regional body composition. (Body Fat USA)


When used together, the two tests can provide more context than either test alone.


Consider this hypothetical comparison:

At the baseline appointment:

  • Fat mass was 52 pounds.
  • Lean mass was 120 pounds.
  • Measured RMR was 1,650 calories per day.


After 16 weeks:

  • Fat mass was 42 pounds.
  • Lean mass was 118 pounds.
  • Measured RMR was 1,520 calories per day.


The comparison shows:

  • Fat mass decreased by 10 pounds.
  • Lean mass decreased by 2 pounds.
  • RMR decreased by 130 calories per day.


The DEXA comparison provides information about what changed in the body. The RMR comparison shows that resting expenditure also changed.


However, these results would not establish that all 130 calories of the RMR decrease resulted from lean-mass loss or metabolic adaptation.


Some decrease would be expected because the person now has less total body mass. Hydration, energy restriction, preparation, testing variability, and changes in multiple tissues may also contribute.


The combined tests help describe the change. They do not independently explain every cause.

Body Fat USA offers both individual RMR testing and combined DEXA and RMR appointments. Current service and pricing information is available on the Body Fat USA pricing page. (Body Fat USA)


When to Speak with a Physician or Registered Dietitian

A weight-loss plateau is not automatically a medical emergency. However, testing should not replace medical evaluation when symptoms or health concerns are present.


Discuss the situation with a physician when a plateau or unexpected weight change occurs alongside symptoms such as:

  • Significant or persistent fatigue
  • Difficulty tolerating cold
  • Constipation
  • Dry or thinning hair
  • Heavy or irregular menstrual periods
  • Unexplained swelling
  • A noticeably slowed heart rate
  • New depression or cognitive changes
  • Other unexplained physical symptoms


These symptoms are not proof of a thyroid condition, but several are associated with hypothyroidism and warrant appropriate medical discussion when persistent or concerning. (NIDDK)


Medical guidance is also appropriate when:

  • You have diabetes, kidney disease, heart disease, or another chronic condition.
  • You are taking medication that may affect appetite, body weight, or energy expenditure.
  • You are using a prescription weight-management medication and progress has changed.
  • Your weight is changing rapidly without an obvious explanation.
  • You are considering an extremely low-calorie diet.
  • Eating or exercise behaviors are becoming compulsive, restrictive, or difficult to control.


A registered dietitian can evaluate whether your recorded intake is nutritionally adequate, help interpret energy needs, and develop an individualized plan within the context of your health and preferences. NIH guidance recognizes registered dietitians and other trained healthcare professionals as part of individualized weight-management care. (NHLBI, NIH)


When to Consider Repeat RMR Testing

RMR is not a fixed number for life.


Repeat testing may be useful:

  • After a meaningful change in body weight
  • After a measurable change in body composition
  • During a sustained weight-loss plateau
  • After completing an extended weight-loss phase
  • When transitioning from weight loss to maintenance
  • After a substantial change in training volume or lifestyle
  • When a qualified professional wants updated information for planning


Testing every few days or every week is unlikely to provide useful insight. Short intervals make it difficult to separate meaningful physiological change from normal test variability.

For the most useful comparison, repeat the original preparation conditions as closely as possible.


Body Fat USA’s preparation instructions include:

  • Consume only water for at least four hours before testing.
  • Avoid black coffee, tea, gum, and other “zero-calorie” items during the fasting period.
  • Avoid caffeine and other stimulants before the test.
  • Avoid exercise on the day of testing.
  • Arrive calm and allow your body to rest before and during the measurement. (Body Fat USA)


Whenever possible, schedule repeat appointments at a similar time of day and under similar sleep, hydration, food, medication, and activity conditions.


An RMR Test Is a Measurement, Not a Diagnosis

A weight-loss plateau does not automatically mean your metabolism is damaged.


Your body may require fewer calories after weight loss. Daily movement may have changed. Food intake may be difficult to estimate. Water retention may be masking fat loss. Metabolic adaptation may also be contributing.


An RMR test can help determine how many calories your body is currently using at rest. It can identify whether a generalized calculator appears to be substantially overestimating or underestimating that portion of your energy expenditure.


What it cannot do is measure your entire daily calorie burn, confirm your food intake, diagnose a medical condition, or independently explain why your weight has stopped changing.


The most useful interpretation combines:

  • A measured RMR
  • Body-weight trends
  • Body-composition changes
  • Consistent testing conditions
  • Food and activity information
  • Appropriate medical or nutrition guidance when needed


Body Fat USA provides RMR testing in Denver using indirect calorimetry. Clients may schedule an RMR test individually or combine RMR testing with a DEXA body composition scan. (Body Fat USA)


The goal is not to reduce your metabolism to one number.


The goal is to replace some of the guesswork with better information.
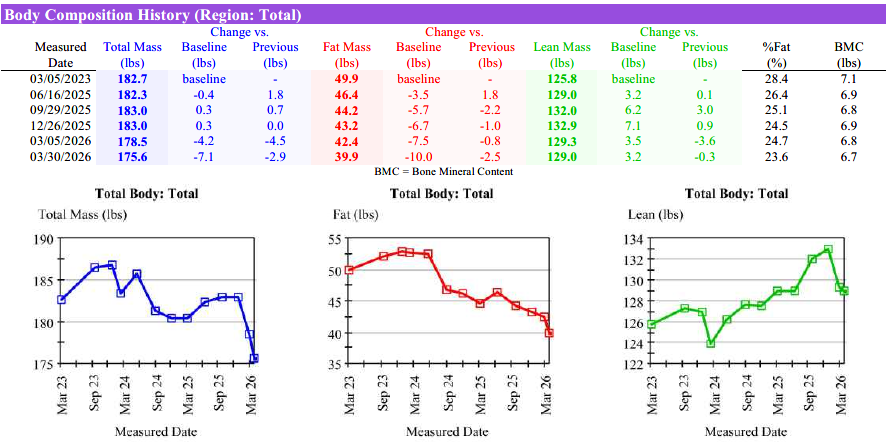
 Body Composition History
By Sean Selters July 17, 2026
A sample of the Body Composition history from a DEXA scan report at Body Fat USA.
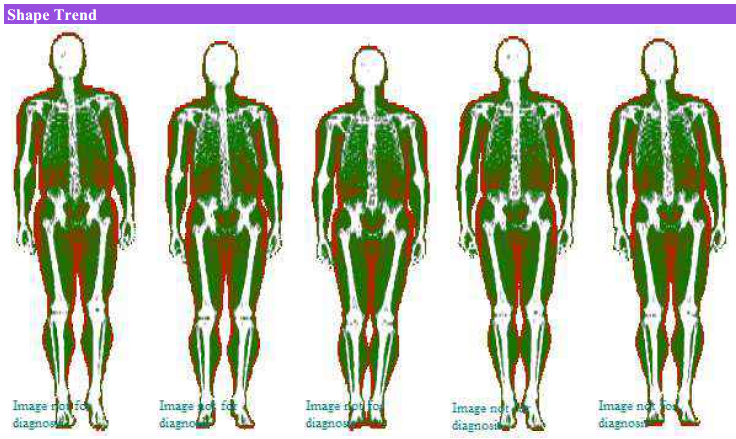
DEXA Scan
By Sean Selters July 17, 2026
DEXA scan's body composition images.
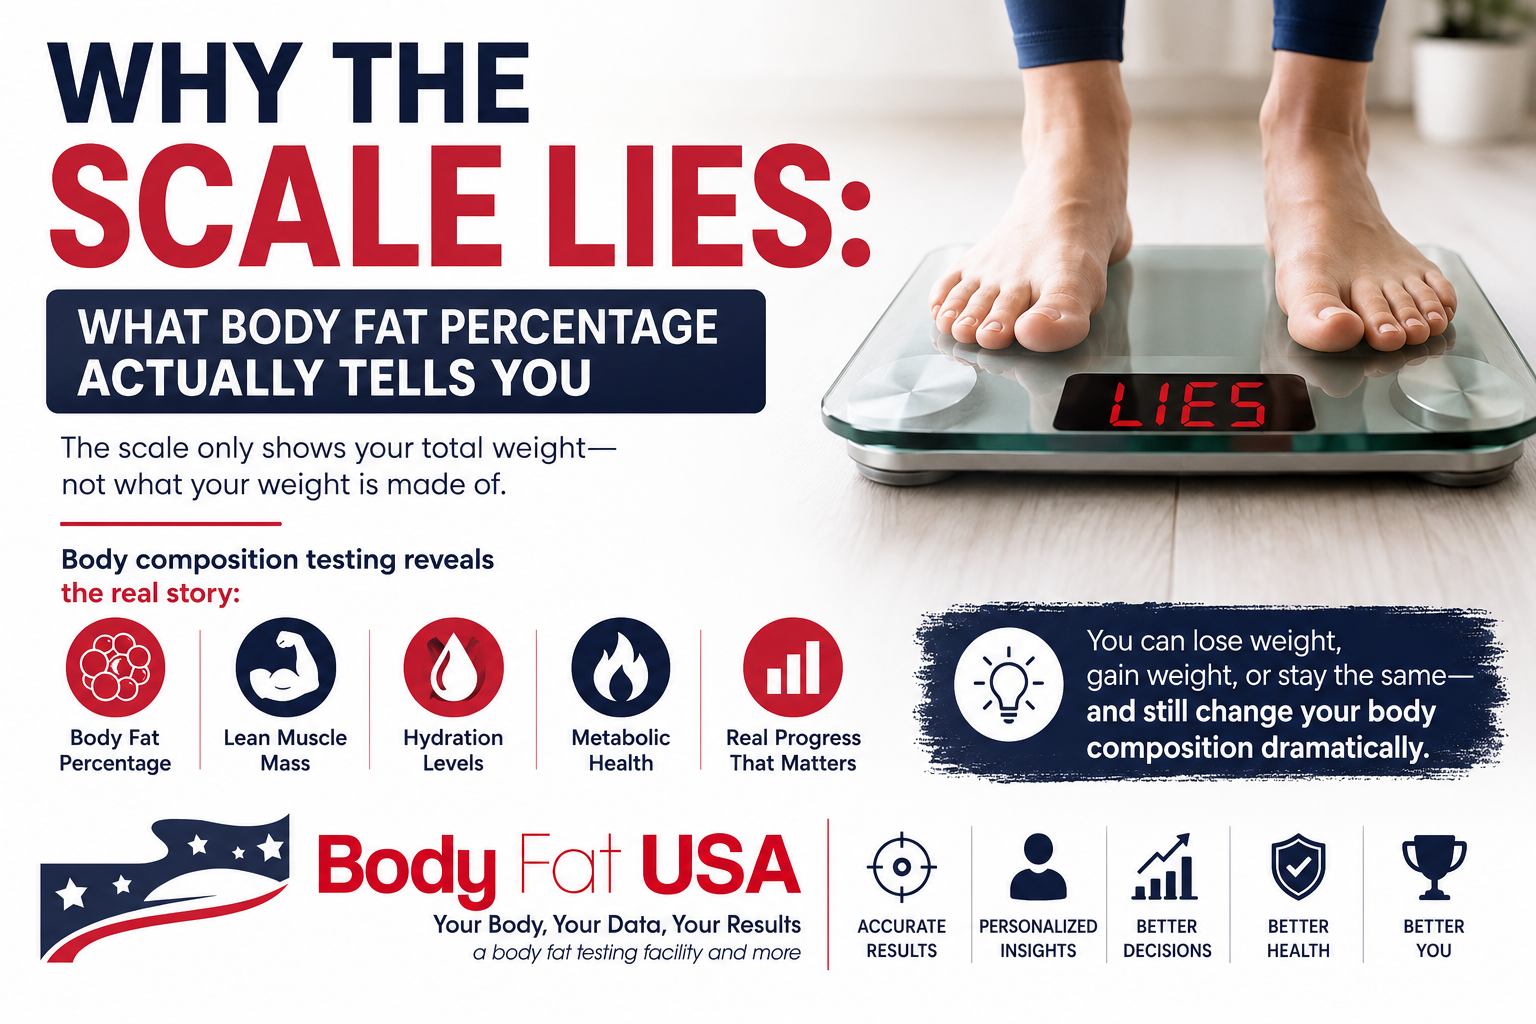
Body Fat USA infographic about body fat percentage, body composition testing, lean muscle mass, and
By Sean Selters May 8, 2026
Learn how body composition testing measures body fat, lean muscle, and real health progress beyond the number on the scale.
By Sean Selters May 8, 2026
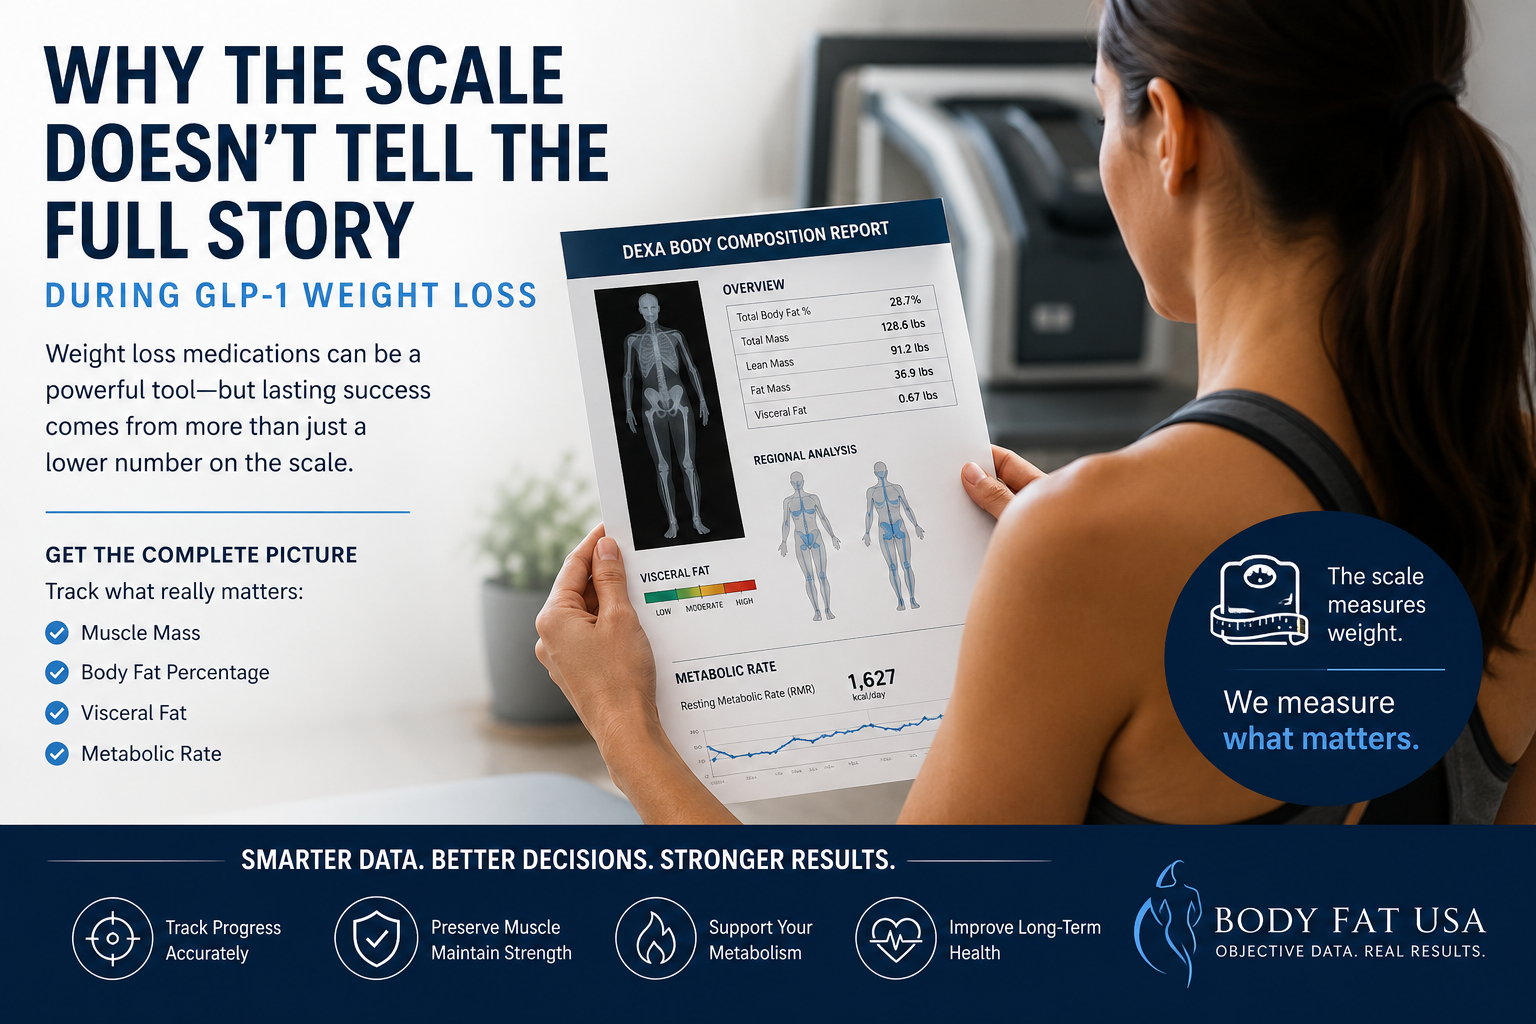
Why the Scale Doesn’t Tell the Full Story During GLP-1 Weight Loss
By Sean Selters December 11, 2025
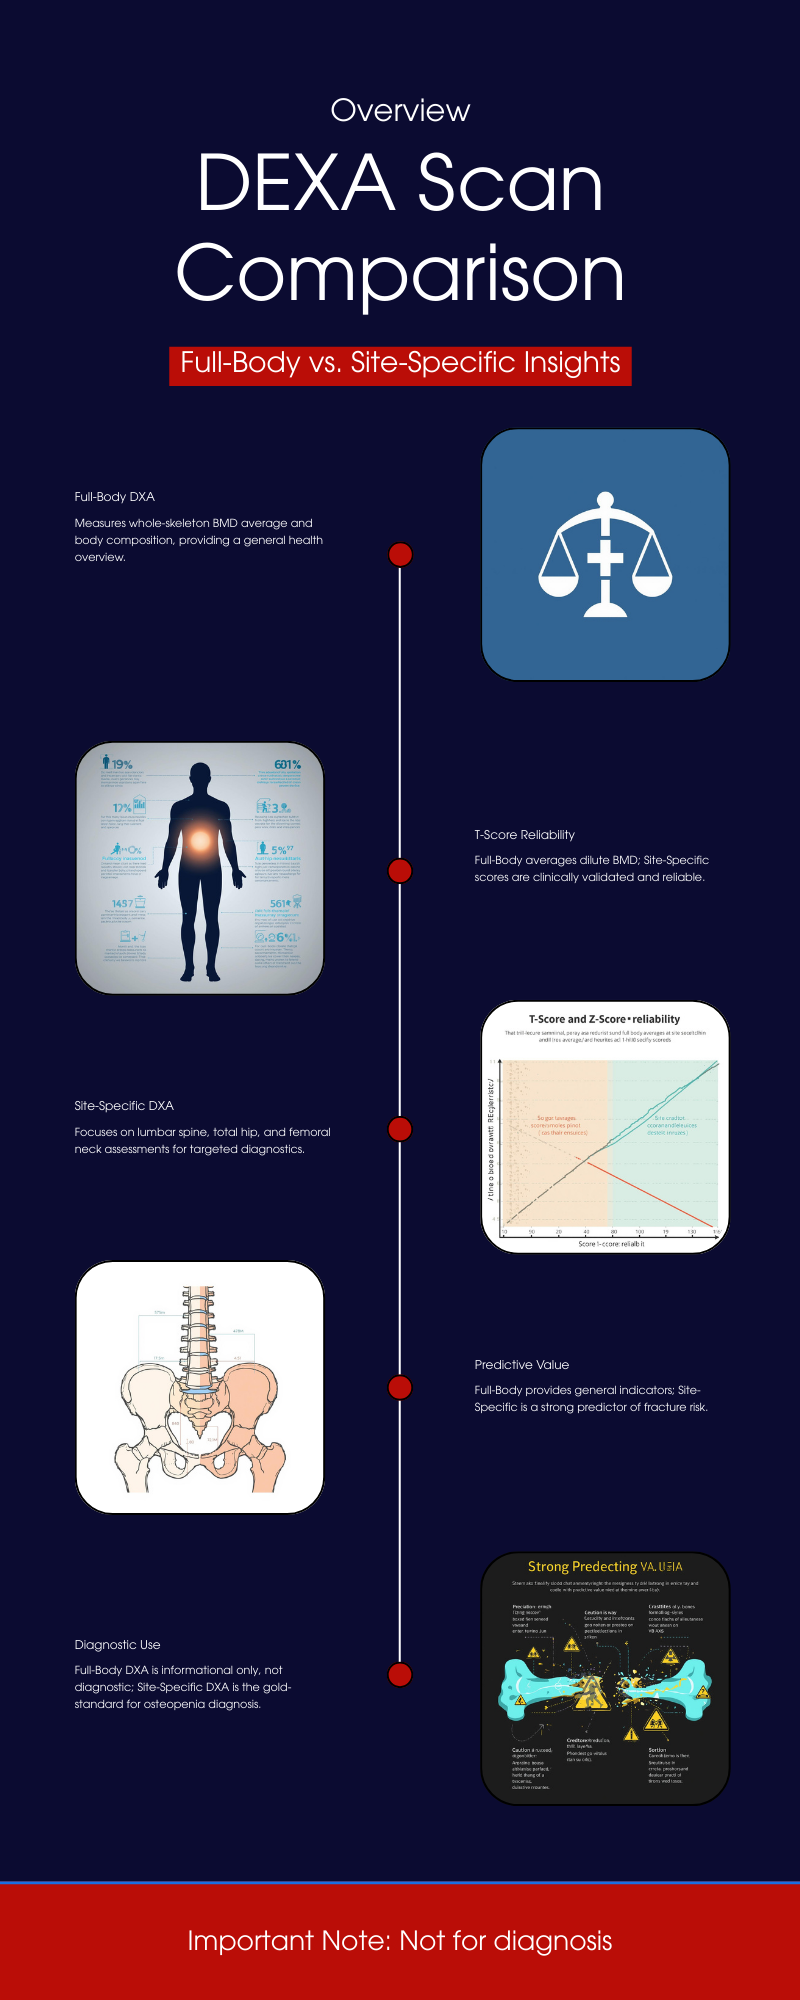
Understanding T-Scores and Z-Scores in DEXA Scans A DXA (DEXA) scan measures bone mineral density (BMD) at specific regions of the skeleton. The results are reported as: T-score : The number of standard deviations your BMD is above or below the peak bone mass of a young healthy adult (age ~30 reference). This is the basis for diagnosing osteoporosis or osteopenia in postmenopausal women and men over 50. For example, a T-score ≥ –1.0 is considered normal, between –1.0 and –2.5 indicates low bone mass (osteopenia), and ≤ –2.5 indicates osteoporosis. (These WHO categories apply to older adults; younger people are assessed differently, as explained below.) Z-score : The number of standard deviations your BMD is above or below the average for your age, sex, and size. Z-scores are used mainly for younger individuals (premenopausal women, men under 50, and children) to see if bone density is unusually low for their age. A Z-score below –2.0 is considered “below the expected range for age,” which might prompt investigation for underlying causes of bone loss. Z-scores are not used to diagnose osteoporosis in older adults – that diagnosis relies on T-scores and clinical criteria. Each DXA scan yields T-scores and Z-scores for the specific site measured. Site-specific DXA scans typically target the lumbar spine, hip (femoral neck and/or total hip), or sometimes the forearm (radius). In contrast, a full-body DXA scan measures the entire skeleton’s BMD (often reported as an average for the whole body). It’s important to understand how these differ in practice and diagnostic value. Site-Specific DXA Scans: Gold Standard for Bone Health Assessment Central (site-specific) DXA scans of the lumbar spine and hip are the clinical gold standard for assessing bone health and diagnosing osteopenia/osteoporosis. These sites have been validated as strong predictors of fracture risk and are the basis for official diagnostic criteria. Key points about site-specific DXA: Diagnostic Accuracy: BMD measurements at the spine and hip have a well-established relationship with fracture risk. Low BMD at these sites strongly correlates with higher likelihood of osteoporotic fractures (e.g., hip fractures, vertebral fractures). For this reason, the World Health Organization (WHO) and clinical guidelines focus on spine and hip T-scores for diagnosis. The WHO’s reference standard is a T-score at the femoral neck –2.5 or below to define osteoporosis. In practice, osteoporosis can be diagnosed if the T-score is ≤ –2.5 at either the lumbar spine, total hip, or femoral neck (and in certain cases the 33% radius) in a postmenopausal woman or man ≥50. These site-specific thresholds have been shown to identify individuals at elevated fracture risk. Osteopenia vs Osteoporosis: Using site-specific DXA, a patient is classified as having normal bone density, osteopenia, or osteoporosis based on the lowest T-score among the measured sites. It’s common for different sites to yield slightly different T-scores (for example, spine may show osteoporosis while hip is osteopenic, or vice versa). Clinicians typically consider the lowest T-score for diagnosis and management, since it represents the person’s greatest degree of bone loss. This ensures that localized osteoporosis is not overlooked. Forearm and Other Sites: The forearm (usually the one-third radius of the non-dominant arm) is measured in certain situations – for instance, if spine/hip can’t be measured or interpreted, in hyperparathyroidism (which affects forearm bones), or in very obese patients who exceed the DXA table’s weight limit. The forearm DXA is a peripheral site but still provides a T-score that can be used for diagnosis if needed. However, like other sites, its T-score is specific to that region’s BMD. In general, other skeletal regions (e.g. calcaneus heel ultrasound or finger DXA) are used for screening but not for formal WHO-classification diagnosis of osteoporosis – the internationally accepted diagnostic sites remain lumbar spine, hip, and (secondarily) forearm. Proven Reliability: Site-specific DXA scans have high precision and their T-scores are backed by extensive normative databases and fracture outcome data. For example, femoral neck T-scores in large studies correlate strongly with hip fracture risk, which is why the femoral neck was chosen as the WHO reference site . In short, spine and hip DXA provide a sensitive and specific assessment of bone health and are the cornerstone of osteoporosis diagnosis and management. Full-Body DXA Scans: Purpose and What They Measure A full-body DXA scan (sometimes called total body DXA) scans from head to toe, typically to evaluate body composition (fat mass, lean mass, and bone mass). These scans do report a measurement of overall BMD for the entire skeleton (and can even break down BMD by regions like trunk, legs, arms, etc.), and they will generate T-scores/Z-scores for the whole-body average. However, full-body DXA is generally not used as a primary diagnostic tool for osteoporosis. Important considerations include: Wellness and Monitoring Role: Whole-body DXA is often marketed for wellness or fitness tracking. It gives a single BMD value averaged over all bones. This can be useful for tracking trends in bone density over time (for instance, seeing if overall bone mass is going up or down with exercise, diet, or medication). Some clinics offer full-body scans to younger individuals as a preventive measure, since getting insurance-covered diagnostic DXA before age 65 can be difficult. In those cases, the whole-body BMD serves as a rough baseline to monitor changes  . Non-Diagnostic Nature: Crucially, the whole-body T-score/Z-score is not a substitute for a clinical DXA of the hip/spine. Full-body scans are considered non-diagnostic for bone health. They are typically labeled as such in wellness centers. For example, the report might include a “whole-body BMD T-score” and categorize it (perhaps stating if it falls in the normal/osteopenic range), but with a disclaimer that this is for informational purposes only. UC Davis Health explicitly notes that a whole-body DXA’s bone density result “is not a diagnostic scan to assess the risk of osteopenia and osteoporosis” . In other words, it should not be relied on to make or exclude an osteoporosis diagnosis. If a full-body scan shows low bone density, the appropriate next step is to get a standard DXA at the spine/hip and a medical evaluation. Included Bones: A total body BMD measurement includes areas like the skull, arms, ribs, and pelvis – regions that are not typically the focus for fracture risk. Some of these areas (e.g. skull) tend to maintain density even when spine or hip bones lose density with age. Including them can dilute the impact of very low BMD at critical sites. In children’s bone density assessments, technicians often analyze “whole body less head” BMD for this reason – the head has disproportionate weight in the average and can mask changes in the rest of the skeleton. In adults, the skull and upper extremities contribute to the whole-body score but are less relevant to osteoporotic fracture risk (you don’t typically get “skull osteoporosis”). Thus, a whole-body average may appear higher than the BMD in vulnerable sites like the spine, potentially giving a false sense of security. Resolution and Calibration: DXA machines perform dedicated spine/hip scans with specific calibrations, focusing on those small regions with high resolution. A full-body scan, by contrast, covers a large area; the patient is moved through the scanner continuously. While the machines are calibrated to measure BMD in any mode, there could be minor differences in accuracy or precision when deriving, say, lumbar spine BMD from a whole-body pass versus a focused scan. In fact, some studies caution against using segmental results from a whole-body scan for clinical decisions. The International Society for Clinical Densitometry (ISCD) notes, for example, that segmental analysis of regions (like hip subregions) from a whole-body DXA “should not be used for monitoring treatment” because it may not be as reliable. This implies that a dedicated scan is preferred for precise BMD tracking at key sites. Diagnostic Accuracy: Full-Body vs Site-Specific Measurements Do full-body DXA T-scores correlate with site-specific T-scores? – Yes, to a significant degree. Whole-body BMD tends to rise or fall in parallel with the spine and hip BMD, so individuals with low bone density at the spine/hip often have a below-average whole-body BMD as well. Several studies have explored this relationship: A 2016 study of 152 patients compared whole-body DXA results to simultaneous site-specific DXAs (spine, hip, and forearm). They found moderate-to-strong correlation (Pearson r ~0.66–0.75) between whole-body BMD and regional BMD in adults over 50. In other words, people with higher or lower BMD at the spine/hip tended to likewise have higher or lower overall BMD. Importantly, the diagnostic agreement was not perfect. When the researchers applied the standard T-score thresholds (–1.0 for osteopenia, –2.5 for osteoporosis) to the whole-body results, the whole-body scan missed many cases that were identified by the spine or hip scans. Using the same cutoff points on the whole-body measurement “result[ed] in underestimation of osteoporosis” prevalence . For example, some patients who had osteoporotic T-scores at the hip/spine did not reach –2.5 on the whole-body average T-score, thus the whole-body alone would have categorized them as just osteopenic or even normal. Overall, the study concluded that one cannot directly substitute whole-body values for site-specific values – new (different) cutoff thresholds would be needed if one were to use whole-body DXA for diagnosis, to avoid false negatives. In that same study, they evaluated the predictive accuracy of whole-body BMD for detecting low BMD at the hip. The ROC analysis showed the whole-body BMD had an area-under-the-curve (AUC) of 0.96 for identifying patients with any abnormal hip BMD (osteopenia/osteoporosis), and an AUC of 0.84 for identifying those with outright hip osteoporosis. These high AUC values suggest that whole-body results do have good overall ability to distinguish low bone density – but again, a different threshold or interpretation would be needed. The whole-body scan tended to give BMD values that were higher (since it’s an average), so fewer people crossed the osteoporosis threshold on that measure. In practice, clinicians do not attempt to diagnose based on whole-body AUC or adjusted cutoffs; they simply rely on the direct measurements at the hip/spine. A 2022 analysis of U.S. NHANES population data similarly found strong correlations between total-body DXA measures and dedicated hip/spine measures. In that study, the total-body lumbar region BMD correlated very strongly (r ≈ 0.87) with a standard lumbar spine DXA, and whole-body legs/pelvis regions correlated well (r ~0.67–0.75) with hip DXA results. Moreover, the study looked at associations with actual fracture history: for each 1 SD decrease in BMD (T-score drop), the increase in odds of fracture was similar whether using whole-body BMD or hip/spine BMD. In other words, low whole-body BMD was just as strongly associated with prior fractures as low femoral neck or spine BMD in their sample. The authors concluded that total-body DXA measures are a “valid alternative” for studying BMD and fracture risk in research settings. This reinforces the idea that whole-body scans do reflect true skeletal health to a large extent. Bottom line: Full-body DXA and site-specific DXA tend to agree in broad strokes (people with osteoporosis usually have a low whole-body BMD too), but they are not interchangeable for precise diagnosis. A person might have significant bone loss confined to one area (e.g. lumbar spine) that a whole-body average blurs out. Or, vice versa, a high-density area could compensate for a low-density area in the average. The correlations, while strong, are not perfect; thus an individual’s T-score can differ by measurement site. Limitations of Full-Body DXA for Clinical Diagnosis Using a full-body DXA scan to assess bone health comes with important limitations that affect its diagnostic accuracy and clinical utility: Lack of Standardized Cutoffs: There are no universally accepted T-score thresholds for diagnosing osteoporosis based on whole-body scans. The diagnostic criteria by WHO and ISCD do not include whole-body BMD. If one naively applies the same –2.5 T-score cutoff, studies show many cases will be missed (under-diagnosed) because the whole-skeleton average doesn’t dip as low as the worst affected site. Conversely, if one tried a higher cutoff to catch those cases, it might over-call others. Because of this, whole-body T-scores are not considered clinically reliable for making a yes/no diagnosis of osteoporosis. Localized Bone Loss Gets “Averaged Out”: Osteoporosis often affects certain bones more than others. The hip (proximal femur) and vertebrae have a large proportion of trabecular bone which can lose density rapidly in osteoporosis, whereas cortical-rich bones like the skull or arms may lose density more slowly or later. In a whole-body measurement, the relatively sturdier bones can mask the severity of loss in vulnerable sites. For example, a person with very low spine and hip BMD might still show a “moderate” whole-body BMD because their skull, ribs, and upper limbs are less affected – yielding a whole-body T-score that might be in osteopenic range even though clinically they have osteoporosis in critical regions. As one medical center explains, a whole-body scan “will not perform a detailed analysis of the fracture risk areas that a diagnostic scan will, and can therefore underestimate risk.”  In short, it’s a blunt tool compared to targeted measurements. Differences in Precision: Whole-body scans are typically used for tracking broad changes and body composition, not fine-tuned to small BMD changes at one site. The precision error (test–retest consistency) for total body BMD can be a bit larger than that for spine or hip BMD, especially in people with high body fat or large body size. This means small changes or deficits in a particular region might not be detected as confidently on a full-body scan. Dedicated site scans, with proper positioning and analysis, are more sensitive to small changes in those bones. Clinical Practice and Reimbursement: In practice, when doctors order a DXA for osteoporosis screening or diagnosis, they order the site-specific (spine/hip) DXA. Whole-body DXA is not standard for osteoporosis evaluation, and it may not even be covered by insurance for that purpose. The ISCD official recommendations do not recognize total body scans for diagnosing osteoporosis; instead they emphasize measuring the lumbar spine and hips in all patients, plus forearm if indicated. Full-body scans are mostly found in research studies, sports medicine, or wellness clinics, rather than osteoporosis clinics. As a result, most physicians are not trained to interpret whole-body T-scores in the context of fracture risk – they will rely on the standard sites. A normal whole-body BMD reading would not override a low hip BMD if one were found, and conversely, a low whole-body BMD would still need confirmation with a clinical DXA at the proper sites. Pediatric Note: (For completeness) In children and adolescents, DXA usage differs. Doctors often do perform total body (less head) DXA scans in kids to assess overall bone development, since growing children have changing bone sizes. They interpret results with Z-scores (age/sex matched) rather than T-scores, and do not use the WHO osteoporosis definitions in children. Even in that context, a low “whole body” BMD Z-score in a child would be interpreted alongside a spine BMD Z-score and clinical factors (like fractures) to diagnose pediatric osteoporosis. This highlights again that context and site-specific data matter; an overall number alone isn’t diagnostic without the clinical picture. Guidelines and Expert Recommendations Major bone health organizations consistently recommend site-specific DXA for diagnosis and do not consider full-body scans interchangeable with those measurements: The International Society for Clinical Densitometry (ISCD) and the World Health Organization define osteoporosis based on central DXA sites. ISCD’s official position states that the WHO reference standard is a femoral neck T-score ≤ –2.5 (white female, age 20–29 reference). Osteoporosis may also be diagnosed if the lumbar spine or total hip T-score is ≤ –2.5 (or 33% radius in certain cases). Nowhere do these guidelines mention a whole-body measurement for diagnosis. In fact, ISCD explicitly instructs practitioners to measure BMD at the spine and hip in all patients, adding forearm if needed, and notes that other regions (Ward’s triangle, trochanter, etc.) should not be used for diagnosis – by extension, a composite whole-body value is also not an approved diagnostic site. The WHO’s operational definition of osteoporosis (from 1994, still in use) was derived from epidemiologic data using hip measurements. Therefore, the T-score categories (normal/osteopenia/osteoporosis) are validated for the hip (and later applied to spine), but not for an aggregate BMD of the entire skeleton. Experts caution against trying to apply those same cut-points to a total body scan. Doing so can lead to misclassification – typically missing true cases (false negatives) as noted earlier. Expert recommendations instead suggest that if a whole-body DXA is performed and indicates low bone density, it should be followed up with a standard DXA at the clinically relevant sites. Patient advocacy and osteoporosis organizations (like the National Osteoporosis Foundation, now the Bone Health & Osteoporosis Foundation) educate that bone density testing is usually done at the spine and hip, and that diagnosis is based on those results. A full-body scan might be mentioned as part of a body composition test but is not part of official osteoporosis screening guidance. For example, UC Davis Sports Medicine (which offers wellness DXA scans) clearly labels their whole-body bone density output as informational and not a comprehensive fracture risk assessment, warning that it “can be used to identify systemic issues and track changes over time” but is not sufficient to capture risk at key sites. In summary, no clinical guidelines endorse full-body DXA for diagnosing osteopenia/osteoporosis. They uniformly call for site-specific measurements. Full-body DXA results are not considered clinically interchangeable with dedicated spine/hip DXA results. If there is any concern about bone health (low T/Z from a wellness scan, risk factors for osteoporosis, etc.), the individual should undergo a proper DXA of the spine and hip as per guidelines. Conclusion While a full-body DXA scan does provide a global picture of bone density and correlates with site-specific bone density, it has important limitations in clinical use. The T-scores and Z-scores from a whole-body scan cannot be interpreted in the same way as those from a spine or hip DXA for diagnosing osteoporosis. Whole-body scans tend to underestimate the presence of osteoporosis when using standard cutoffs, because they average BMD across the entire skeleton and don’t hone in on the critical fracture-prone sites. Site-specific DXA scans (spine, hip, and forearm) remain the gold standard for diagnostic accuracy. They directly measure the areas most predictive of fracture risk and have established normative databases and thresholds for clinical decisions. In contrast, full-body DXA is best regarded as a supplemental tool – useful for research, general health monitoring, or early screening – but not a definitive diagnostic test. It is excellent for tracking trends in overall bone mass (for instance, seeing improvement with therapy or exercise), and research shows it correlates with fracture risk on a population level , yet in an individual patient it should complement, not replace, the standard site measurements. In practice, if a full-body DXA scan indicates low bone density (a worrisome T-score or Z-score), the prudent approach is to follow up with a conventional DXA at the lumbar spine and hip for a thorough evaluation . Conversely, a “normal” whole-body BMD does not guarantee that osteoporosis isn’t present in a specific bone; one could still have localized low BMD that requires attention. Therefore, clinicians do not treat or make decisions based on whole-body DXA scores alone, and current expert guidelines do not consider those scores interchangeable with site-specific results. The consensus is to rely on site-specific T-scores for diagnosing osteopenia/osteoporosis and assessing fracture risk, using full-body scans only as an adjunct for broad insight into skeletal health.  CLICK HERE to book your DEXA scan today! Sources: • BodySpec wellness DXA FAQ – differentiation between whole-body “wellness” BMD and diagnostic BMD. • UC Davis Health Sports Medicine – explanation of whole-body DXA output and its limits for osteoporosis risk. • Rajaei et al., Iran J Radiol. (2016) – study showing correlation of total-body vs regional BMD and how using standard site cutoffs on whole-body BMD underestimates osteoporosis prevalence. • Jain & Vokes, J. Clin. Densitom. (2022) – analysis of NHANES data indicating total-body BMD correlates with spine/hip BMD and is associated with fracture risk (supporting validity for population studies). • ISCD Official Positions (2019/2023) – guidelines on DXA use, indicating osteoporosis diagnosis is based on spine/hip (or 33% radius) T-scores, not whole-body scans.
By Sean Selters November 12, 2025
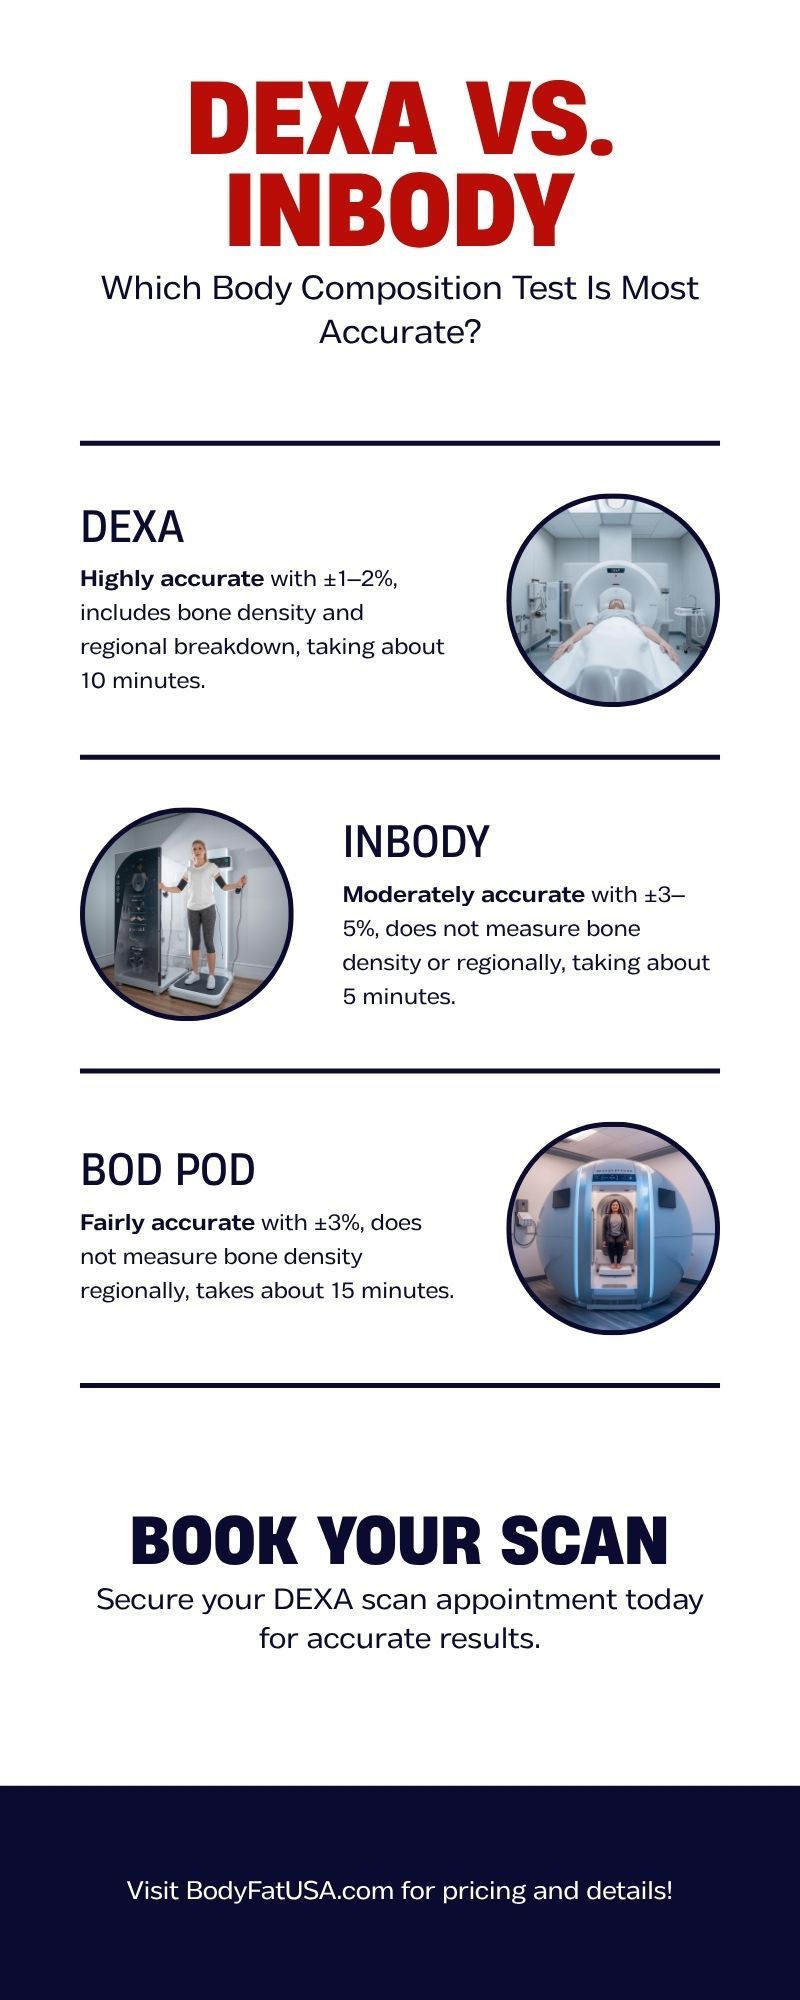
When you’re serious about your fitness journey, “close enough” doesn’t cut it. You want real, reliable data — not estimates that shift with the weather. That’s where body composition testing comes in. But with options like DEXA scans, InBody, and Bod Pod, which one truly gives you the most accurate picture of your health? Let’s find out. ⸻ What Is a DEXA Scan? DEXA (Dual-Energy X-ray Absorptiometry) is widely recognized as the gold standard for measuring body composition. Originally designed for bone density testing, the DEXA uses two low-dose X-ray beams to measure: • Body fat percentage • Lean muscle mass • Bone mineral density Because the scan analyzes your body segment by segment—arms, legs, and trunk—it provides insight that’s far more detailed than a single number. ✅ DEXA scan accuracy: ±1–2% variance That’s clinical-grade precision used in hospitals, sports labs, and research settings. ⏱ Scan time: About 7 - 12 minutes. 💡 Pro tip: No prep required—just show up and lie still. ⸻ What Is an InBody Test? InBody and similar devices use bioelectrical impedance analysis (BIA). You stand barefoot on a platform and hold sensors while a small electrical current passes through your body. The device estimates fat and lean mass based on electrical resistance. It’s convenient and widely available at gyms and health clubs—but it’s also sensitive to hydration, food intake, and time of day. ⚠️ A single glass of water can change your body fat reading. InBody accuracy: ±3–5% variance (or more under real-world conditions) ⏱ Time: About 5 minutes. It’s fine for tracking broad trends, but not reliable enough for medical or performance benchmarking. ⸻ What Is a Bod Pod Test? The Bod Pod measures body composition through air displacement plethysmography. You sit in a sealed chamber, and it calculates your body density by how much air you displace. In perfect lab conditions, the Bod Pod can be fairly accurate—around ±3%—but clothing, hair, and even breathing patterns can throw it off. It also lacks regional data, so you won’t know where your muscle or fat is distributed. ⸻ DEXA vs. InBody vs. Bod Pod: The Comparison Test Type Accuracy Measures Bone Density Regional Breakdown Affected by Hydration Average Time DEXA Scan ±1–2% ✅ Yes ✅ Yes ❌ No ~10 min InBody (BIA) ±3–5% ❌ No ❌ No ✅ Yes ~5 min Bod Pod ±3% ❌ No ❌ No ⚠️ Slightly ~15 min ⸻ Why DEXA Comes Out on Top When accuracy and consistency matter, DEXA wins every time. Unlike other tests, DEXA scans provide repeatable, actionable results—allowing you to measure fat loss, muscle gain, and bone health with confidence. That means no guessing, no hydration tricks, and no relying on averages. In short: If you want to see your progress instead of hoping for it, DEXA is the way to go. ⸻ Get Your DEXA Scan at Body Fat USA At Body Fat USA, we use a GE Lunar Prodigy DEXA system—the same model trusted by research institutions and pro sports programs. Each scan includes: • Total body fat, lean mass, and bone density • Segmental (arms, legs, trunk) breakdown • Visceral fat measurement • Progress tracking for long-term comparison DEXA Scan: $85 or Combo with Resting Metabolic Rate (RMR) Test: $175 👉 Book your DEXA Scan now at www.BodyFatUSA.com ⸻ Key Takeaways • DEXA Scan = Most accurate, detailed, and consistent • InBody = Convenient, but easily skewed by hydration • Bod Pod = Decent lab tool, limited practical use • Best for athletes, dieters, and anyone tracking serious goals: DEXA. Ready to book your DEXA scan? CLICK HERE
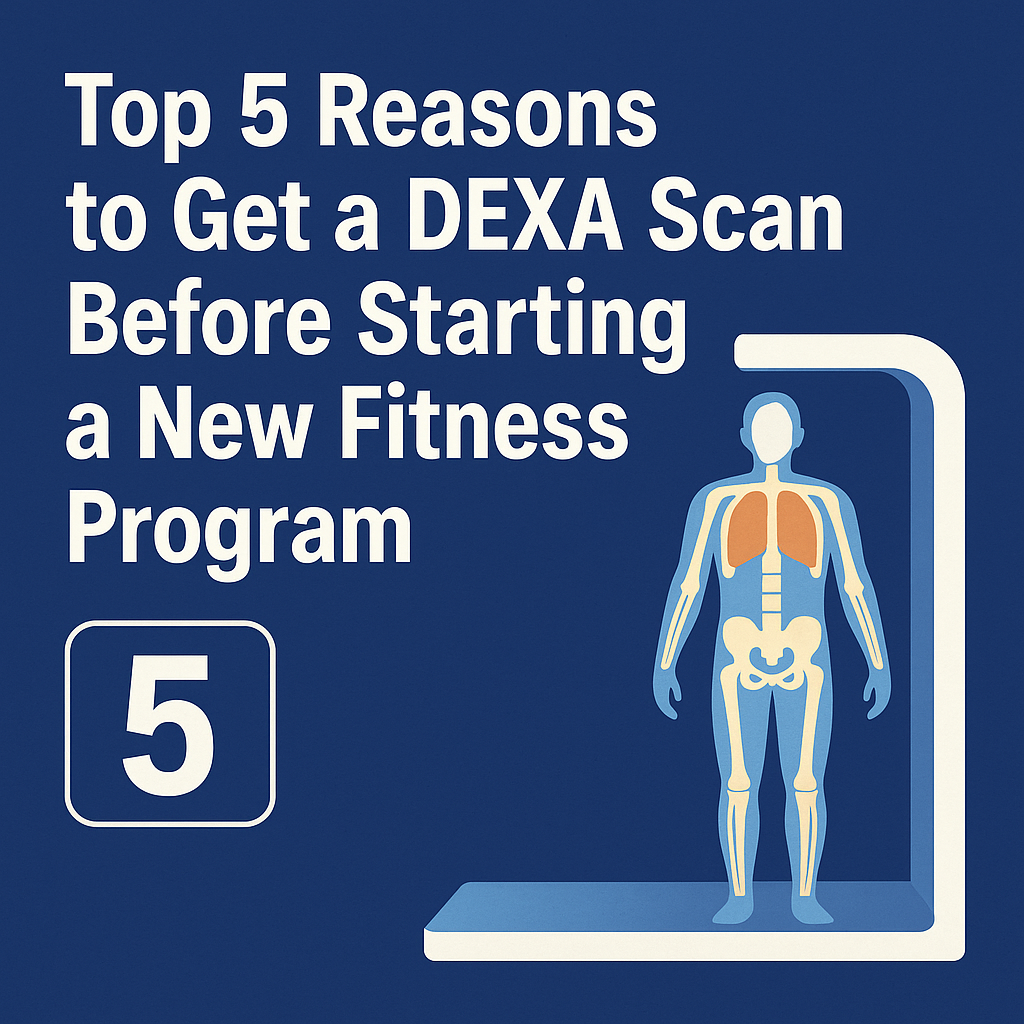
5 Reasons to Get a DEXA Scan Before Starting a New Fitness Program
By Sean Selters July 16, 2025
Starting a new workout program? A DEXA scan helps you set better goals, track real results, and avoid common fitness mistakes. Here’s why it should come first.
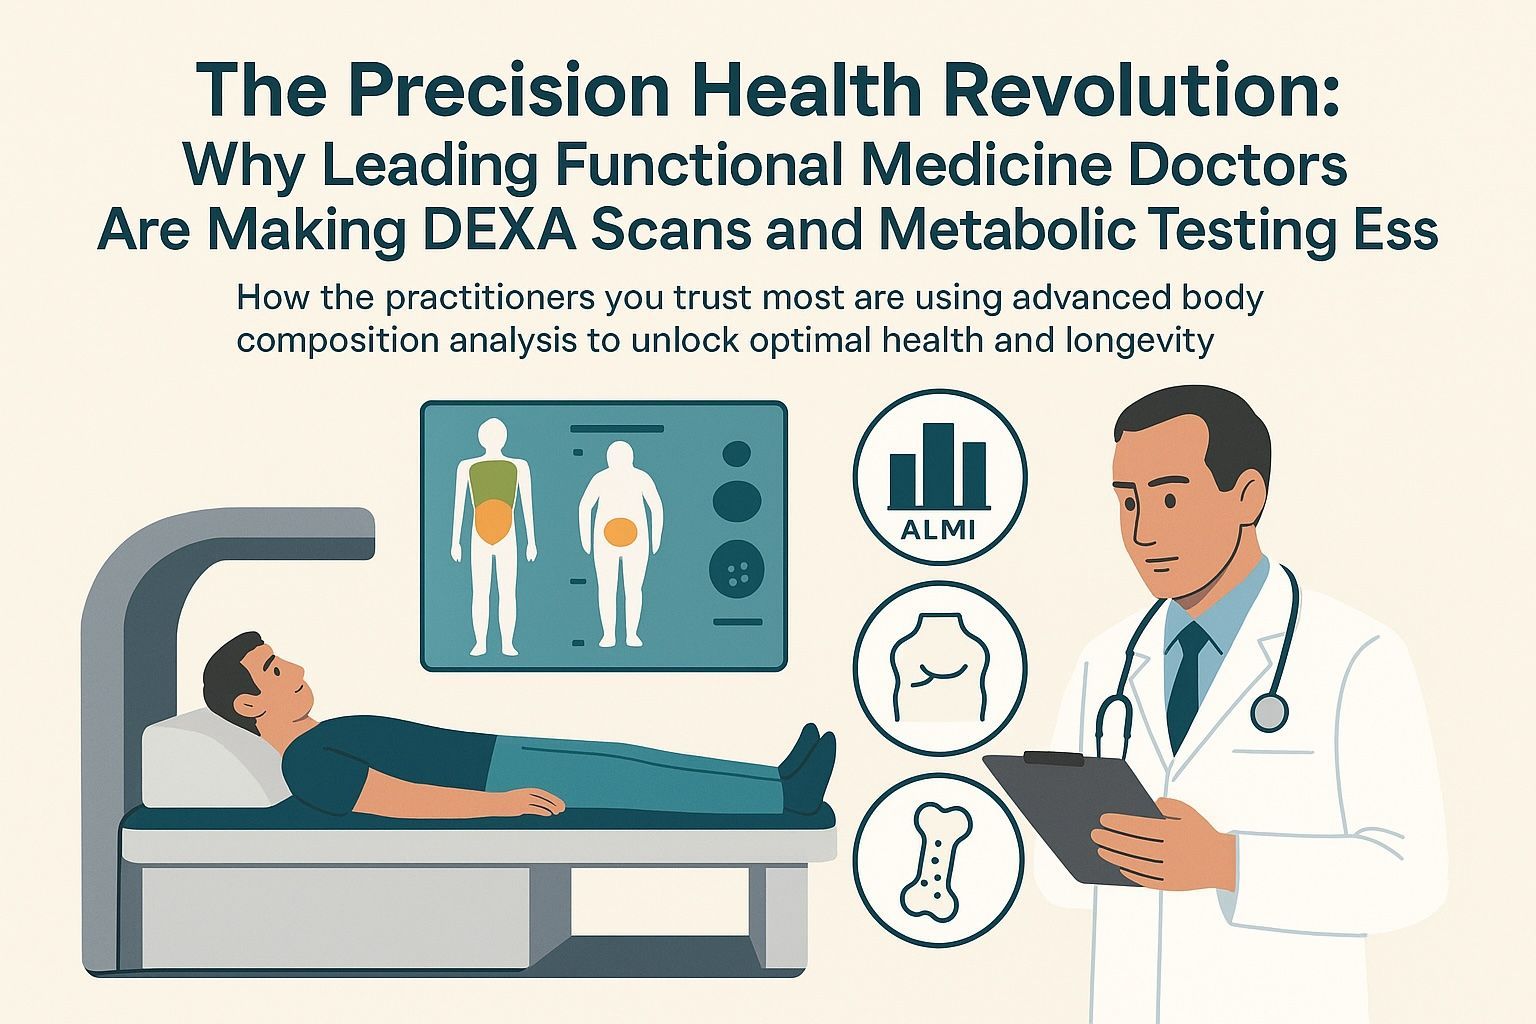
DEXA scan procedure showing body composition analysis with ALMI muscle mass and bone density measure
By Sean Selters July 9, 2025
Discover why leading functional medicine doctors like Dr. Mark Hyman & Dr. Peter Attia recommend DEXA scans. Get affordable DEXA ($80) & RMR testing in Denver.
By Sean Selters June 25, 2025
Discover how Netflix's 'You Are What You Eat' sparked DEXA scan awareness. Get the same precise body composition testing as the twins in Denver.
By Sean Selters June 18, 2025
Learn to read your DEXA scan results like a pro. Complete step-by-step guide to understanding body fat %, bone density, and muscle mass. Denver's DEXA experts.